Z-score Calculator
Use this calculator to compute the z-score of a normal distribution.
Z-score and Probability Converter
Please provide any one value to convert between z-score and probability. This is the equivalent of referencing a z-table.
Result
Given Z = 1.33,
| P(x<Z) = 0.90824 | |
| P(x>Z) = 0.091759 | |
| P(0<x<Z) = 0.40824 | |
| P(-Z<x<Z) = 0.81648 | |
| P(x<-Z or x>Z) = 0.18352 |
Probability between Two Z-scores
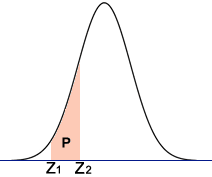
Use this calculator to find the probability (area P in the diagram) between two z-scores.
What is z-score?
The z-score, also referred to as standard score, z-value, and normal score, among other things, is a dimensionless quantity that is used to indicate the signed, fractional, number of standard deviations by which an event is above the mean value being measured. Values above the mean have positive z-scores, while values below the mean have negative z-scores.
The z-score can be calculated by subtracting the population mean from the raw score, or data point in question (a test score, height, age, etc.), then dividing the difference by the population standard deviation:
| z = |
|
where x is the raw score, μ is the population mean, and σ is the population standard deviation. For a sample, the formula is similar, except that the sample mean and population standard deviation are used instead of the population mean and population standard deviation.
The z-score has numerous applications and can be used to perform a z-test, calculate prediction intervals, process control applications, comparison of scores on different scales, and more.
Z-table
A z-table, also known as a standard normal table or unit normal table, is a table that consists of standardized values that are used to determine the probability that a given statistic is below, above, or between the standard normal distribution. A z-score of 0 indicates that the given point is identical to the mean. On the graph of the standard normal distribution, z = 0 is therefore the center of the curve. A positive z-value indicates that the point lies to the right of the mean, and a negative z-value indicates that the point lies left of the mean. There are a few different types of z-tables.
The values in the table below represent the area between z = 0 and the given z-score.
| z | 0 | 0.01 | 0.02 | 0.03 | 0.04 | 0.05 | 0.06 | 0.07 | 0.08 | 0.09 |
| 0 | 0 | 0.00399 | 0.00798 | 0.01197 | 0.01595 | 0.01994 | 0.02392 | 0.0279 | 0.03188 | 0.03586 |
| 0.1 | 0.03983 | 0.0438 | 0.04776 | 0.05172 | 0.05567 | 0.05962 | 0.06356 | 0.06749 | 0.07142 | 0.07535 |
| 0.2 | 0.07926 | 0.08317 | 0.08706 | 0.09095 | 0.09483 | 0.09871 | 0.10257 | 0.10642 | 0.11026 | 0.11409 |
| 0.3 | 0.11791 | 0.12172 | 0.12552 | 0.1293 | 0.13307 | 0.13683 | 0.14058 | 0.14431 | 0.14803 | 0.15173 |
| 0.4 | 0.15542 | 0.1591 | 0.16276 | 0.1664 | 0.17003 | 0.17364 | 0.17724 | 0.18082 | 0.18439 | 0.18793 |
| 0.5 | 0.19146 | 0.19497 | 0.19847 | 0.20194 | 0.2054 | 0.20884 | 0.21226 | 0.21566 | 0.21904 | 0.2224 |
| 0.6 | 0.22575 | 0.22907 | 0.23237 | 0.23565 | 0.23891 | 0.24215 | 0.24537 | 0.24857 | 0.25175 | 0.2549 |
| 0.7 | 0.25804 | 0.26115 | 0.26424 | 0.2673 | 0.27035 | 0.27337 | 0.27637 | 0.27935 | 0.2823 | 0.28524 |
| 0.8 | 0.28814 | 0.29103 | 0.29389 | 0.29673 | 0.29955 | 0.30234 | 0.30511 | 0.30785 | 0.31057 | 0.31327 |
| 0.9 | 0.31594 | 0.31859 | 0.32121 | 0.32381 | 0.32639 | 0.32894 | 0.33147 | 0.33398 | 0.33646 | 0.33891 |
| 1 | 0.34134 | 0.34375 | 0.34614 | 0.34849 | 0.35083 | 0.35314 | 0.35543 | 0.35769 | 0.35993 | 0.36214 |
| 1.1 | 0.36433 | 0.3665 | 0.36864 | 0.37076 | 0.37286 | 0.37493 | 0.37698 | 0.379 | 0.381 | 0.38298 |
| 1.2 | 0.38493 | 0.38686 | 0.38877 | 0.39065 | 0.39251 | 0.39435 | 0.39617 | 0.39796 | 0.39973 | 0.40147 |
| 1.3 | 0.4032 | 0.4049 | 0.40658 | 0.40824 | 0.40988 | 0.41149 | 0.41308 | 0.41466 | 0.41621 | 0.41774 |
| 1.4 | 0.41924 | 0.42073 | 0.4222 | 0.42364 | 0.42507 | 0.42647 | 0.42785 | 0.42922 | 0.43056 | 0.43189 |
| 1.5 | 0.43319 | 0.43448 | 0.43574 | 0.43699 | 0.43822 | 0.43943 | 0.44062 | 0.44179 | 0.44295 | 0.44408 |
| 1.6 | 0.4452 | 0.4463 | 0.44738 | 0.44845 | 0.4495 | 0.45053 | 0.45154 | 0.45254 | 0.45352 | 0.45449 |
| 1.7 | 0.45543 | 0.45637 | 0.45728 | 0.45818 | 0.45907 | 0.45994 | 0.4608 | 0.46164 | 0.46246 | 0.46327 |
| 1.8 | 0.46407 | 0.46485 | 0.46562 | 0.46638 | 0.46712 | 0.46784 | 0.46856 | 0.46926 | 0.46995 | 0.47062 |
| 1.9 | 0.47128 | 0.47193 | 0.47257 | 0.4732 | 0.47381 | 0.47441 | 0.475 | 0.47558 | 0.47615 | 0.4767 |
| 2 | 0.47725 | 0.47778 | 0.47831 | 0.47882 | 0.47932 | 0.47982 | 0.4803 | 0.48077 | 0.48124 | 0.48169 |
| 2.1 | 0.48214 | 0.48257 | 0.483 | 0.48341 | 0.48382 | 0.48422 | 0.48461 | 0.485 | 0.48537 | 0.48574 |
| 2.2 | 0.4861 | 0.48645 | 0.48679 | 0.48713 | 0.48745 | 0.48778 | 0.48809 | 0.4884 | 0.4887 | 0.48899 |
| 2.3 | 0.48928 | 0.48956 | 0.48983 | 0.4901 | 0.49036 | 0.49061 | 0.49086 | 0.49111 | 0.49134 | 0.49158 |
| 2.4 | 0.4918 | 0.49202 | 0.49224 | 0.49245 | 0.49266 | 0.49286 | 0.49305 | 0.49324 | 0.49343 | 0.49361 |
| 2.5 | 0.49379 | 0.49396 | 0.49413 | 0.4943 | 0.49446 | 0.49461 | 0.49477 | 0.49492 | 0.49506 | 0.4952 |
| 2.6 | 0.49534 | 0.49547 | 0.4956 | 0.49573 | 0.49585 | 0.49598 | 0.49609 | 0.49621 | 0.49632 | 0.49643 |
| 2.7 | 0.49653 | 0.49664 | 0.49674 | 0.49683 | 0.49693 | 0.49702 | 0.49711 | 0.4972 | 0.49728 | 0.49736 |
| 2.8 | 0.49744 | 0.49752 | 0.4976 | 0.49767 | 0.49774 | 0.49781 | 0.49788 | 0.49795 | 0.49801 | 0.49807 |
| 2.9 | 0.49813 | 0.49819 | 0.49825 | 0.49831 | 0.49836 | 0.49841 | 0.49846 | 0.49851 | 0.49856 | 0.49861 |
| 3 | 0.49865 | 0.49869 | 0.49874 | 0.49878 | 0.49882 | 0.49886 | 0.49889 | 0.49893 | 0.49896 | 0.499 |
| 3.1 | 0.49903 | 0.49906 | 0.4991 | 0.49913 | 0.49916 | 0.49918 | 0.49921 | 0.49924 | 0.49926 | 0.49929 |
| 3.2 | 0.49931 | 0.49934 | 0.49936 | 0.49938 | 0.4994 | 0.49942 | 0.49944 | 0.49946 | 0.49948 | 0.4995 |
| 3.3 | 0.49952 | 0.49953 | 0.49955 | 0.49957 | 0.49958 | 0.4996 | 0.49961 | 0.49962 | 0.49964 | 0.49965 |
| 3.4 | 0.49966 | 0.49968 | 0.49969 | 0.4997 | 0.49971 | 0.49972 | 0.49973 | 0.49974 | 0.49975 | 0.49976 |
| 3.5 | 0.49977 | 0.49978 | 0.49978 | 0.49979 | 0.4998 | 0.49981 | 0.49981 | 0.49982 | 0.49983 | 0.49983 |
| 3.6 | 0.49984 | 0.49985 | 0.49985 | 0.49986 | 0.49986 | 0.49987 | 0.49987 | 0.49988 | 0.49988 | 0.49989 |
| 3.7 | 0.49989 | 0.4999 | 0.4999 | 0.4999 | 0.49991 | 0.49991 | 0.49992 | 0.49992 | 0.49992 | 0.49992 |
| 3.8 | 0.49993 | 0.49993 | 0.49993 | 0.49994 | 0.49994 | 0.49994 | 0.49994 | 0.49995 | 0.49995 | 0.49995 |
| 3.9 | 0.49995 | 0.49995 | 0.49996 | 0.49996 | 0.49996 | 0.49996 | 0.49996 | 0.49996 | 0.49997 | 0.49997 |
| 4 | 0.49997 | 0.49997 | 0.49997 | 0.49997 | 0.49997 | 0.49997 | 0.49998 | 0.49998 | 0.49998 | 0.49998 |
How to read the z-table
In the table above,
- the column headings define the z-score to the hundredth's place.
- the row headings define the z-score to the tenth's place.
- each value in the table is the area between z = 0 and the z-score of the given value, which represents the probability that a data point will lie within the referenced region in the standard normal distribution.
For example, referencing the right-tail z-table above, a data point with a z-score of 1.12 corresponds to an area of 0.36864 (row 13, column 4). This means that for a normally distributed population, there is a 36.864% chance, a data point will have a z-score between 0 and 1.12.
Because there are various z-tables, it is important to pay attention to the given z-table to know what area is being referenced.